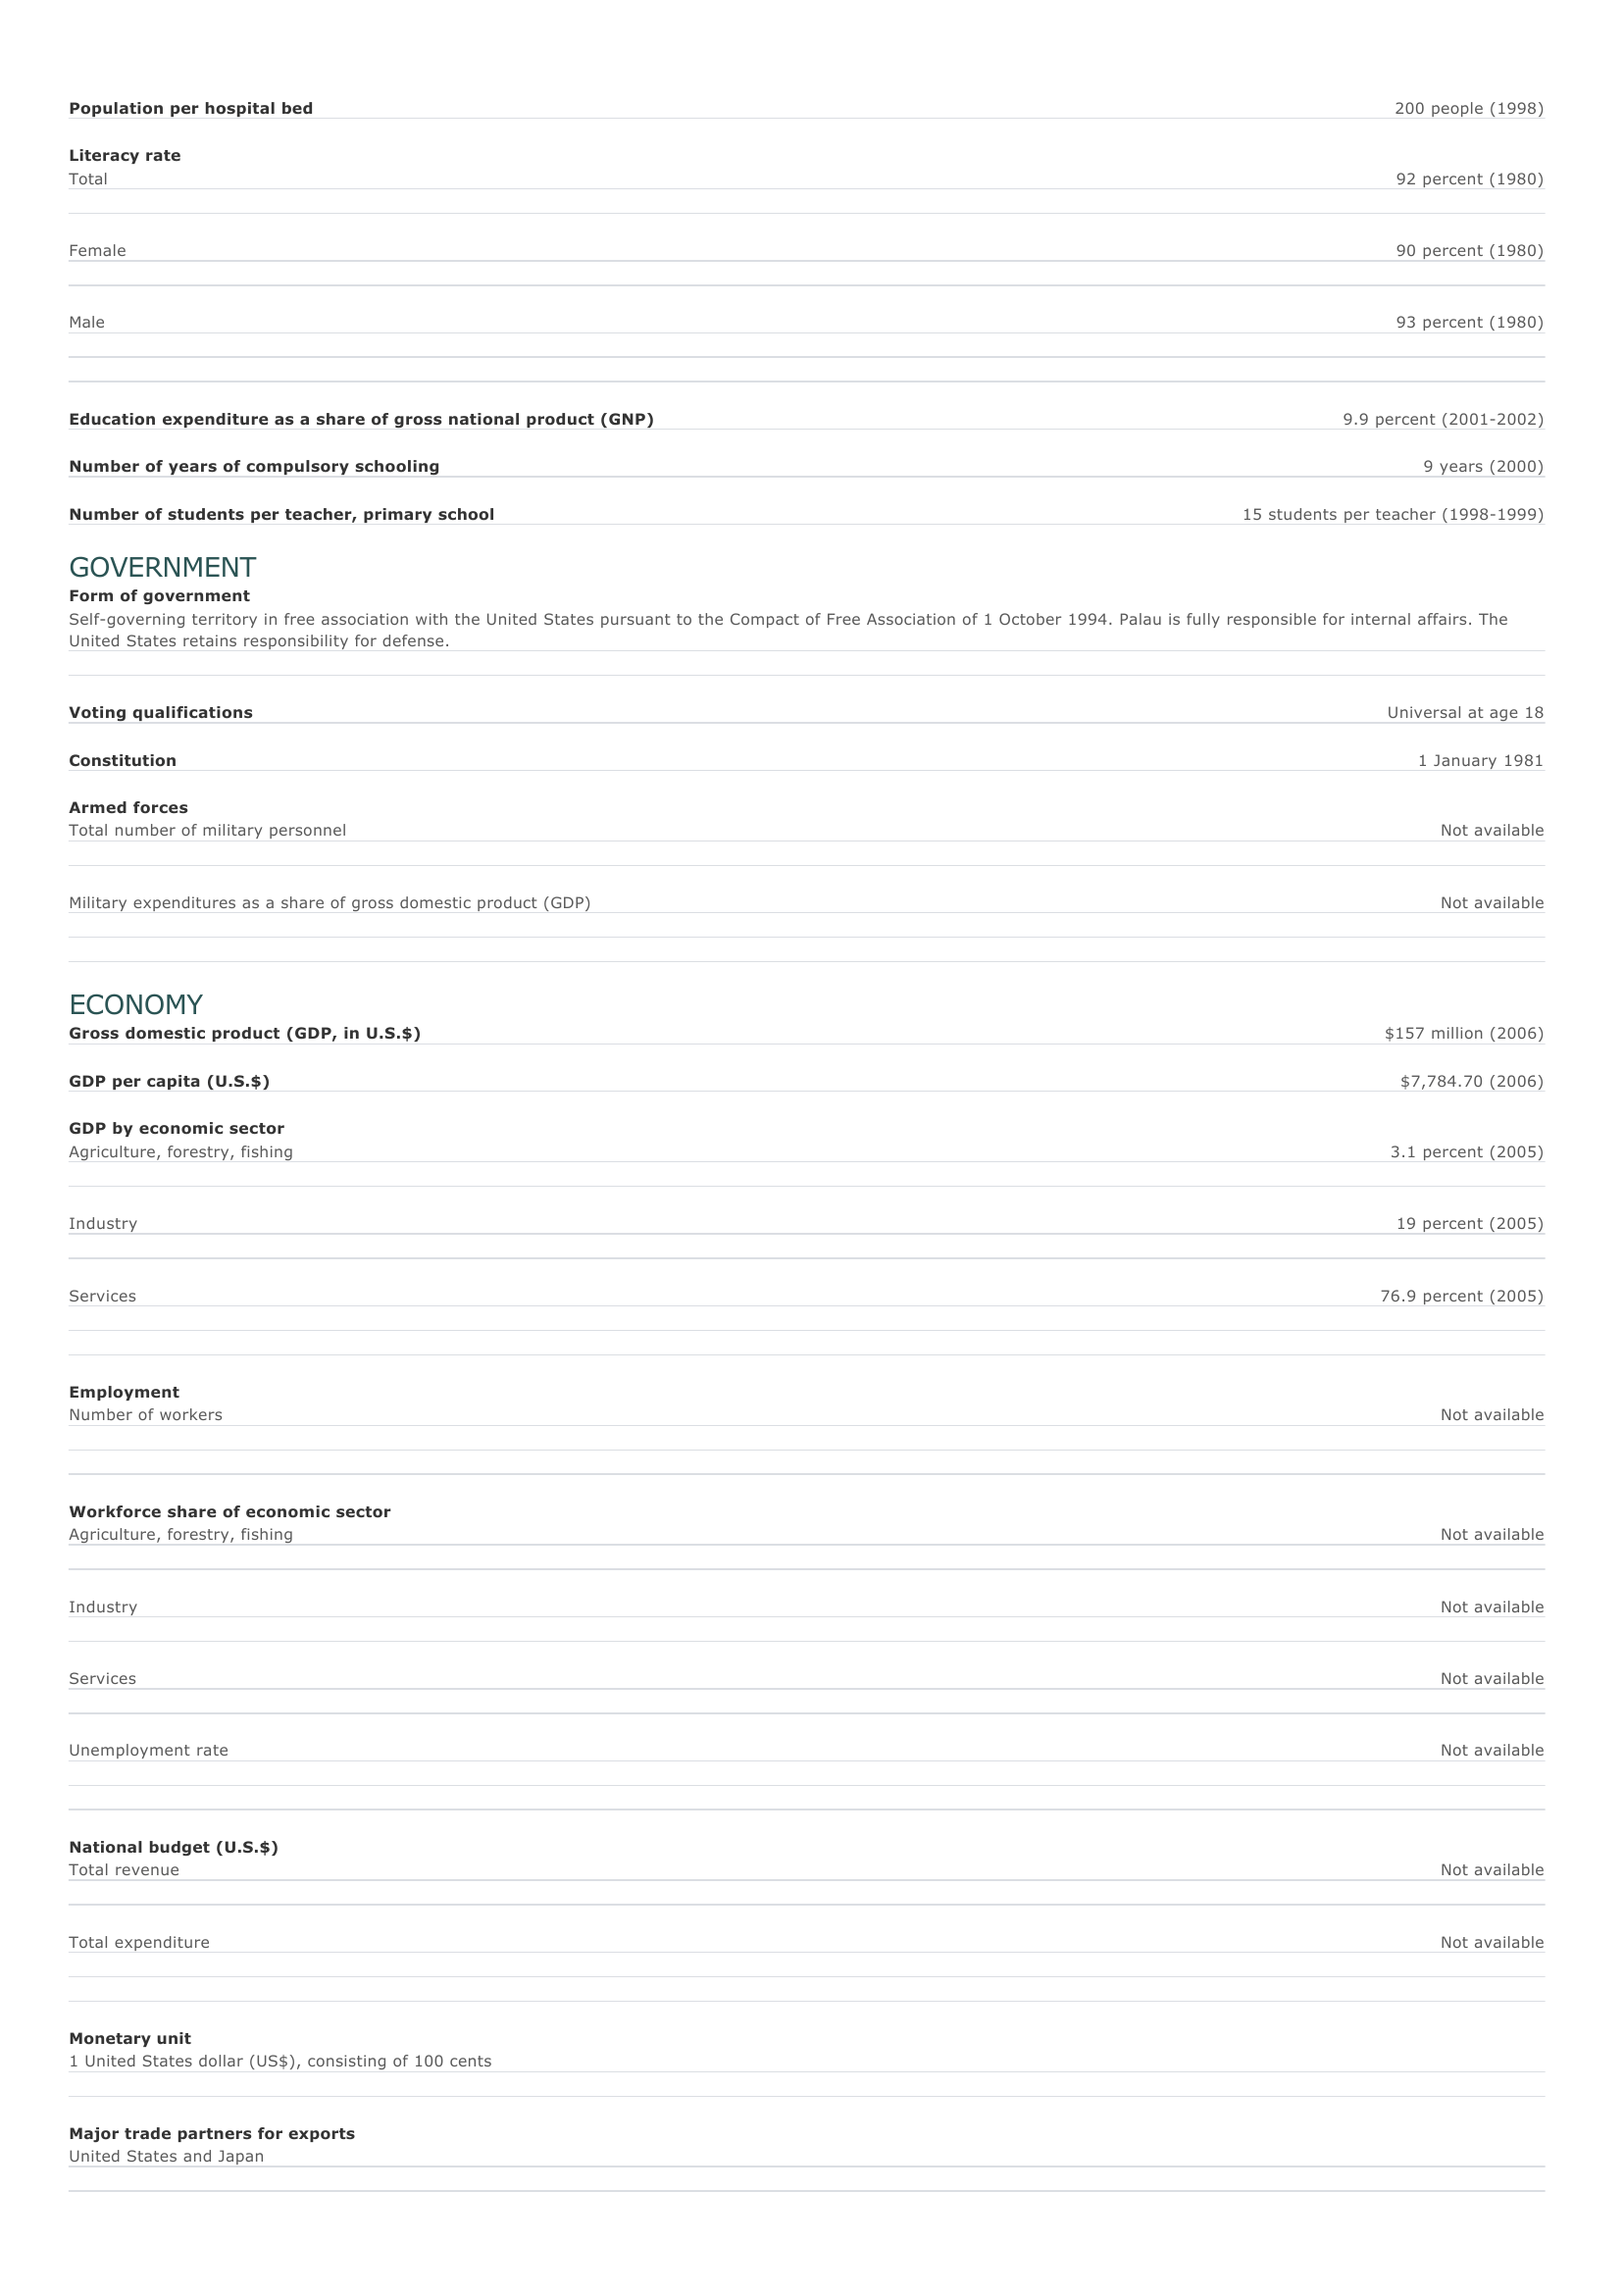
Palau Facts and Figures. BASIC FACTS Official name Capital Area Republic of Palau Koror 488 sq km 188 sq mi PEOPLE Population 21,093 (2008 estimate) Population growth Population growth rate 1.16 percent (2008 estimate) Projected population in 2025 24,320 (2025 estimate) Projected population in 2050 26,300 (2050 estimate) Population density 46 persons per sq km (2008 estimate) 119 persons per sq mi (2008 estimate) Urban/rural distribution Share urban 70 percent (2003 estimate) Share rural 30 percent (2003 estimate) Largest cities, with population Koror 14,000 (2003 estimate) Ethnic groups Palauan (mix of Malay, Melanesian, and Polynesian), Filipino, Chinese Languages Palauan (official), English (official), Sonsorolese, Tobi Religious affiliations Christian 96 percent Roman Catholic 44 percent Protestant 29 percent Other Christian 23 percent Nonreligious 2 percent O ther 2 percent HEALTH AND EDUCATION Life expectancy Total 71 years (2008 estimate) Female 74.4 years (2008 estimate) Male 67.8 years (2008 estimate) Infant mortality rate Population per physician 14 deaths per 1,000 live births (2008 estimate) 917 people (2004) Population per hospital bed 200 people (1998) Literacy rate Total 92 percent (1980) Female 90 percent (1980) Male 93 percent (1980) Education expenditure as a share of gross national product (GNP) Number of years of compulsory schooling Number of students per teacher, primary school 9.9 percent (2001-2002) 9 years (2000) 15 students per teacher (1998-1999) GOVERNMENT Form of government Self-governing territory in free association with the United States pursuant to the Compact of Free Association of 1 October 1994. Palau is fully responsible for internal affairs. The United States retains responsibility for defense. Voting qualifications Constitution Universal at age 18 1 January 1981 Armed forces Total number of military personnel Not available Military expenditures as a share of gross domestic product (GDP) Not available ECONOMY Gross domestic product (GDP, in U.S.$) GDP per capita (U.S.$) GDP by economic sector Agriculture, forestry, fishing $157 million (2006) $7,784.70 (2006) 3.1 percent (2005) I ndustry 19 percent (2005) Services 76.9 percent (2005) Employment Number of workers Not available Workforce share of economic sector Agriculture, forestry, fishing Not available I ndustry Not available Services Not available Unemployment rate Not available National budget (U.S.$) Total revenue Not available Total expenditure Not available Monetary unit 1 United States dollar (US$), consisting of 100 cents Major trade partners for exports United States and Japan Major trade partners for imports Sweden, Japan, Indonesia, Taiwan, and Philippines ENERGY, COMMUNICATIONS, AND TRANSPORTATION Electricity production Electricity from thermal sources Not available Electricity from hydroelectric sources Not available Electricity from nuclear sources Not available Electricity from geothermal, solar, and wind sources Not available Number of radios per 1,000 people 663 (1997) Number of telephones per 1,000 people Not available Number of televisions per 1,000 people 608 (1997 estimate) Number of Internet hosts per 10,000 people 0.53 (2000) Daily newspaper circulation per 1,000 people Not available Number of motor vehicles per 1,000 people Not available Paved road as a share of total roads Not available SOURCES Basic Facts and People sections Area data are from the statistical bureaus of individual countries. Population, population growth rate, and population projections are from the United States Census Bureau, International Programs Center, International Data Base (IDB) (www.census.gov). Urban and rural population data are from the Food and Agriculture Organization (FAO) of the United Nations (UN), FAOSTAT database (www.fao.org). Largest cities population data and political divisions data are from the statistical bureaus of individual countries. Ethnic divisions and religion data are largely from the latest Central Intelligence Agency (CIA) World Factbook and from various country censuses and reports. Language data are largely from the Ethnologue, Languages of the World, Summer Institute of Linguistics International (www.sil.org). Health and Education section Life expectancy and infant mortality data are from the United States Census Bureau, International Programs Center, International database (IDB) (www.census.gov). Population per physician and population per hospital bed data are from the World Health Organization (WHO) (www.who.int). Education data are from the United Nations Educational, Scientific and Cultural Organization (UNESCO) database (www.unesco.org). Government section Government, independence, legislature, constitution, highest court, and voting qualifications data are largely from various government Web sites, the latest Europa World Yearbook, and the latest Central Intelligence Agency (CIA) World Factbook. The armed forces data is from Military Balance. Economy section Gross domestic product (GDP), GDP per capita, GDP by economic sectors, employment, and national budget data are from the World Bank database (www.worldbank.org). Monetary unit, agriculture, mining, manufacturing, exports, imports, and major trade partner information is from the statistical bureaus of individual countries, latest Europa World Yearbook, and various United Nations and International Monetary Fund (IMF) publications. Energy, Communication, and Transportation section Electricity information is from the Energy Information Administration (EIA) database (www.eia.doe.gov). Radio, telephone, television, and newspaper information is from the United Nations Educational, Scientific and Cultural Organization (UNESCO) database (www.unesco.org). Internet hosts, motor vehicles, and road data are from the World Bank database (www.worldbank.org). Note Figures may not total 100 percent due to rounding. Microsoft ® Encarta ® 2009. © 1993-2008 Microsoft Corporation. All rights reserved.


