North Carolina - Facts and Figures.
Publié le 10/05/2013
Extrait du document
«
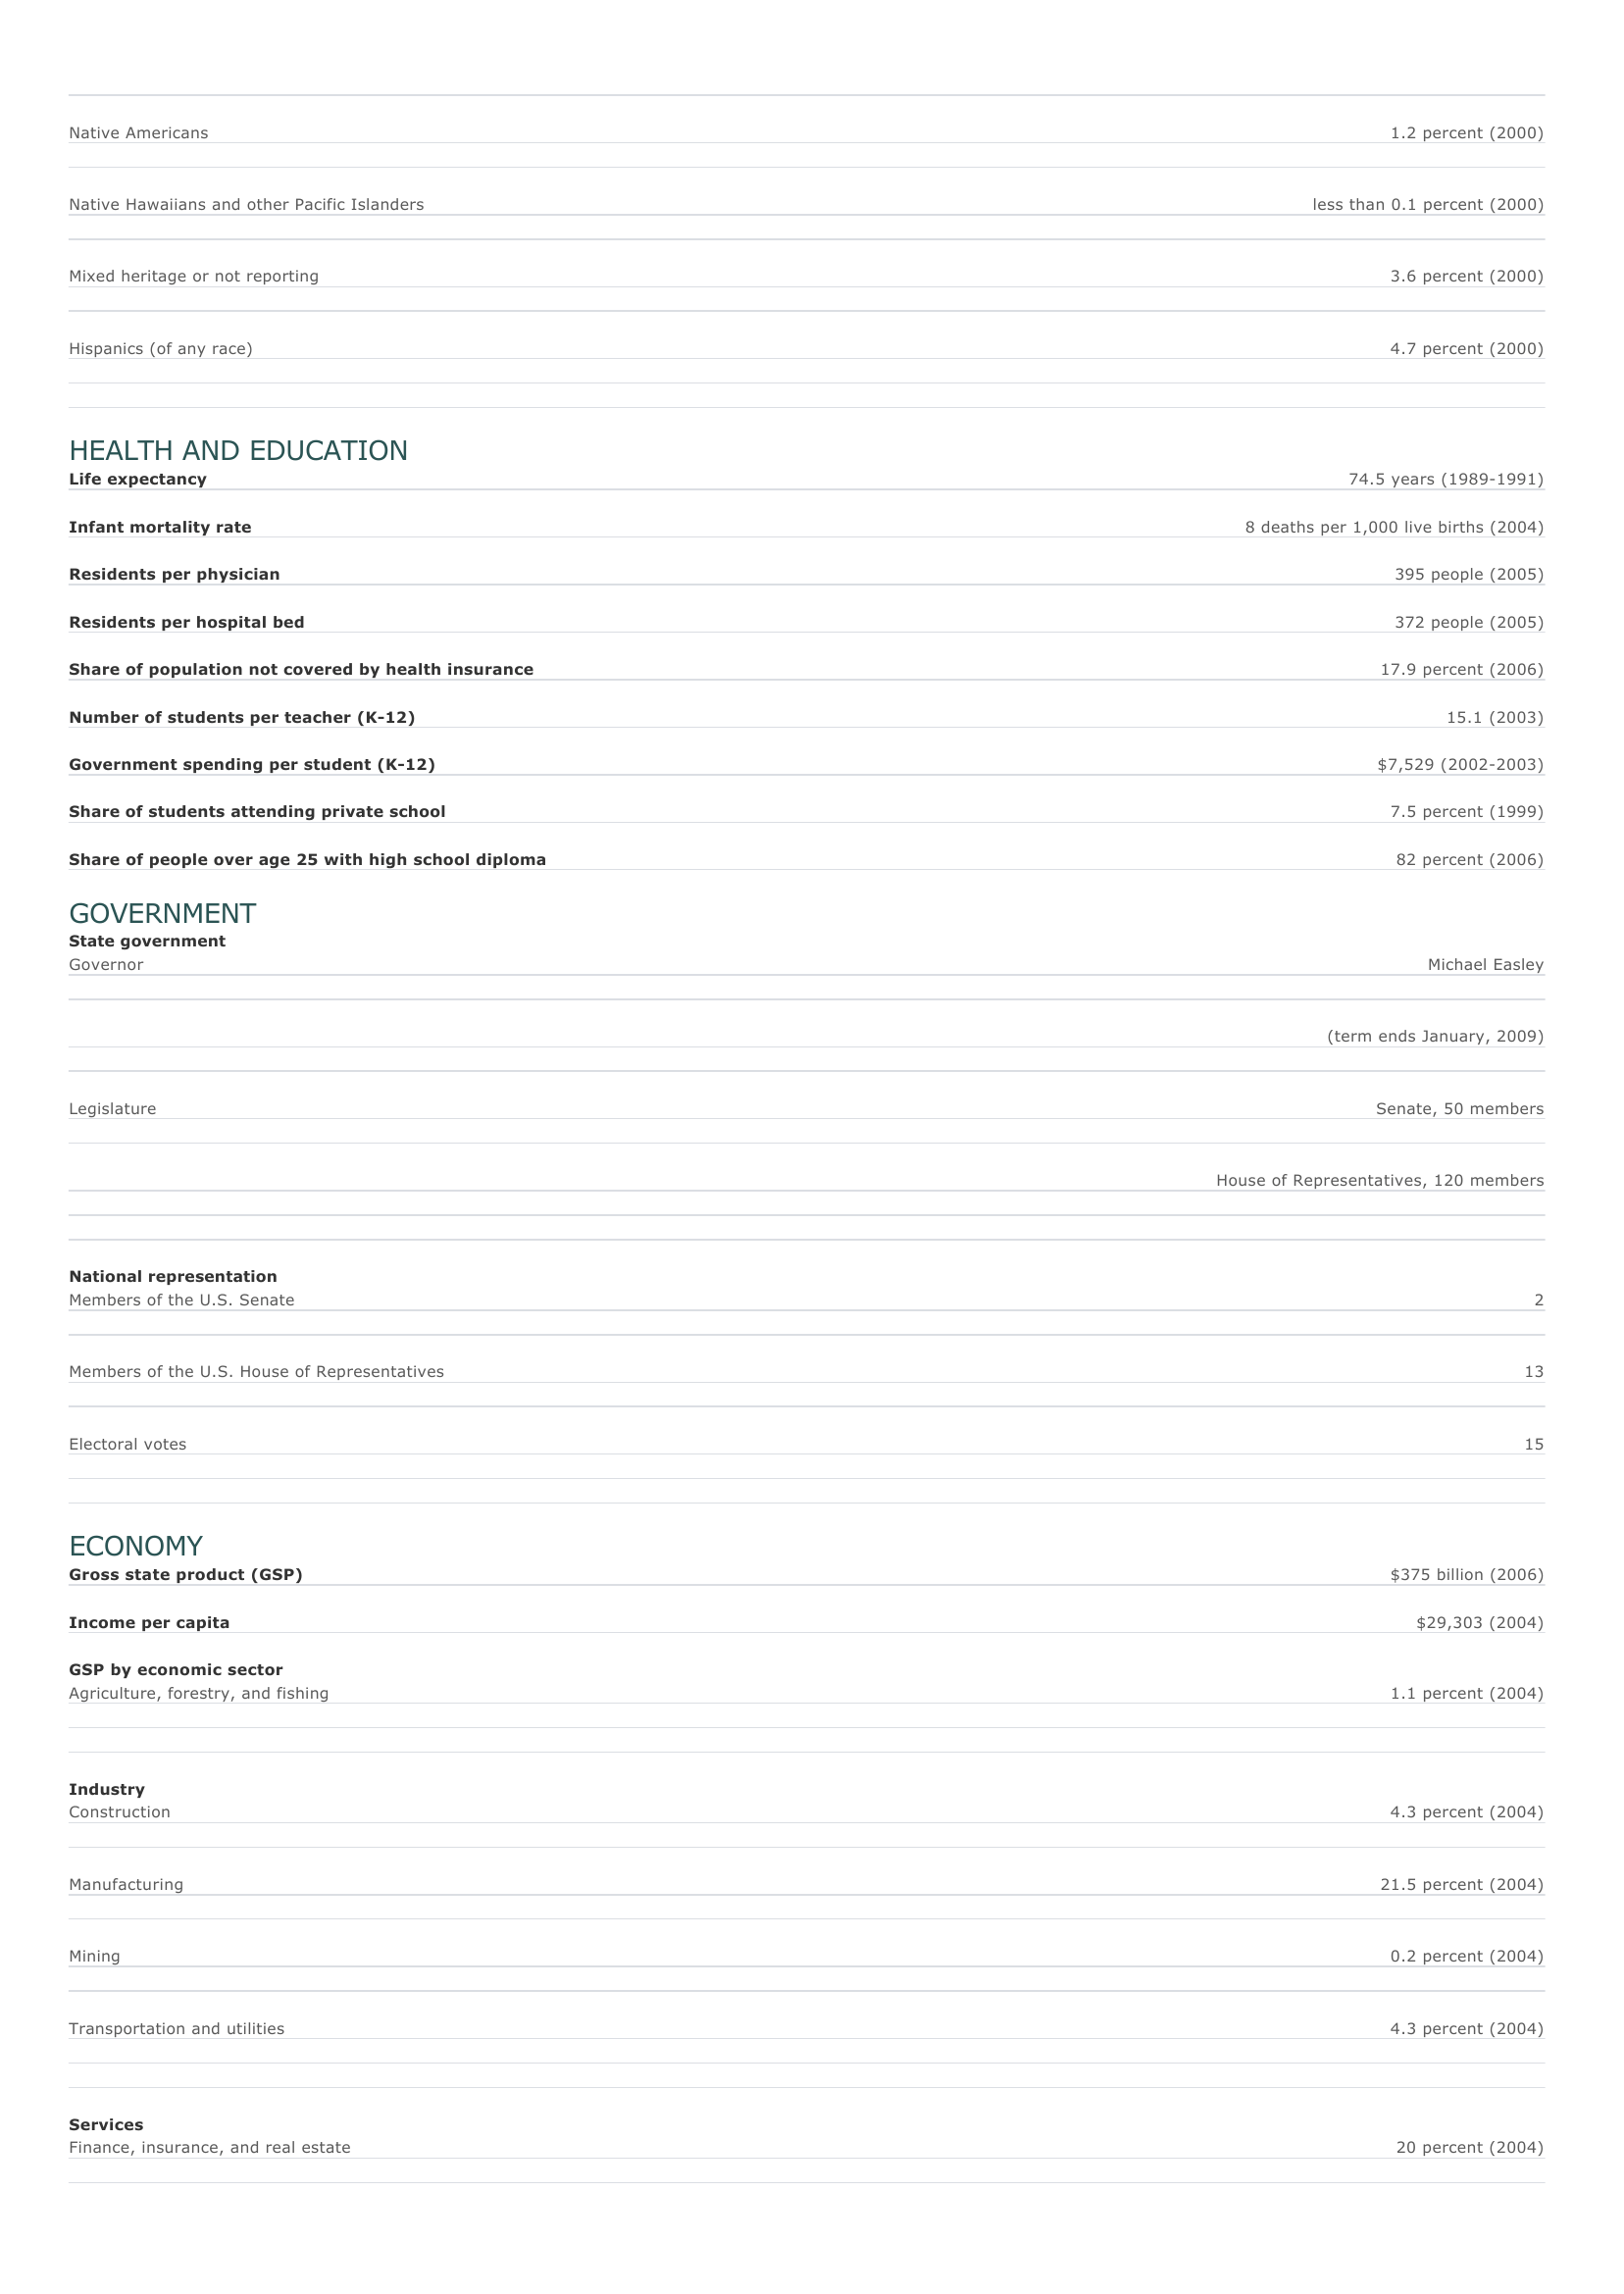
Native Americans 1.2 percent (2000) Native Hawaiians and other Pacific Islanders less than 0.1 percent (2000) Mixed heritage or not reporting 3.6 percent (2000) Hispanics (of any race) 4.7 percent (2000) HEALTH AND EDUCATIONLife expectancy 74.5 years (1989-1991) Infant mortality rate 8 deaths per 1,000 live births (2004) Residents per physician 395 people (2005) Residents per hospital bed 372 people (2005) Share of population not covered by health insurance 17.9 percent (2006) Number of students per teacher (K-12) 15.1 (2003) Government spending per student (K-12) $7,529 (2002-2003) Share of students attending private school 7.5 percent (1999) Share of people over age 25 with high school diploma 82 percent (2006) GOVERNMENTState governmentGovernor Michael Easley (term ends January, 2009) Legislature Senate, 50 members House of Representatives, 120 members National representationMembers of the U.S.
Senate 2 Members of the U.S.
House of Representatives 13 Electoral votes 15 ECONOMYGross state product (GSP) $375 billion (2006) Income per capita $29,303 (2004) GSP by economic sectorAgriculture, forestry, and fishing 1.1 percent (2004) IndustryConstruction 4.3 percent (2004) Manufacturing 21.5 percent (2004) Mining 0.2 percent (2004) Transportation and utilities 4.3 percent (2004) ServicesFinance, insurance, and real estate 20 percent (2004).
»
↓↓↓ APERÇU DU DOCUMENT ↓↓↓
Liens utiles
- North Dakota - Facts and Figures.
- South Carolina - Facts and Figures.
- North Korea Facts and Figures.
- Wyoming - Facts and Figures.
- Wisconsin - Facts and Figures.


