Devoir de Philosophie

New York - Facts and Figures.

Publié le 10/05/2013

Extrait du document
new york
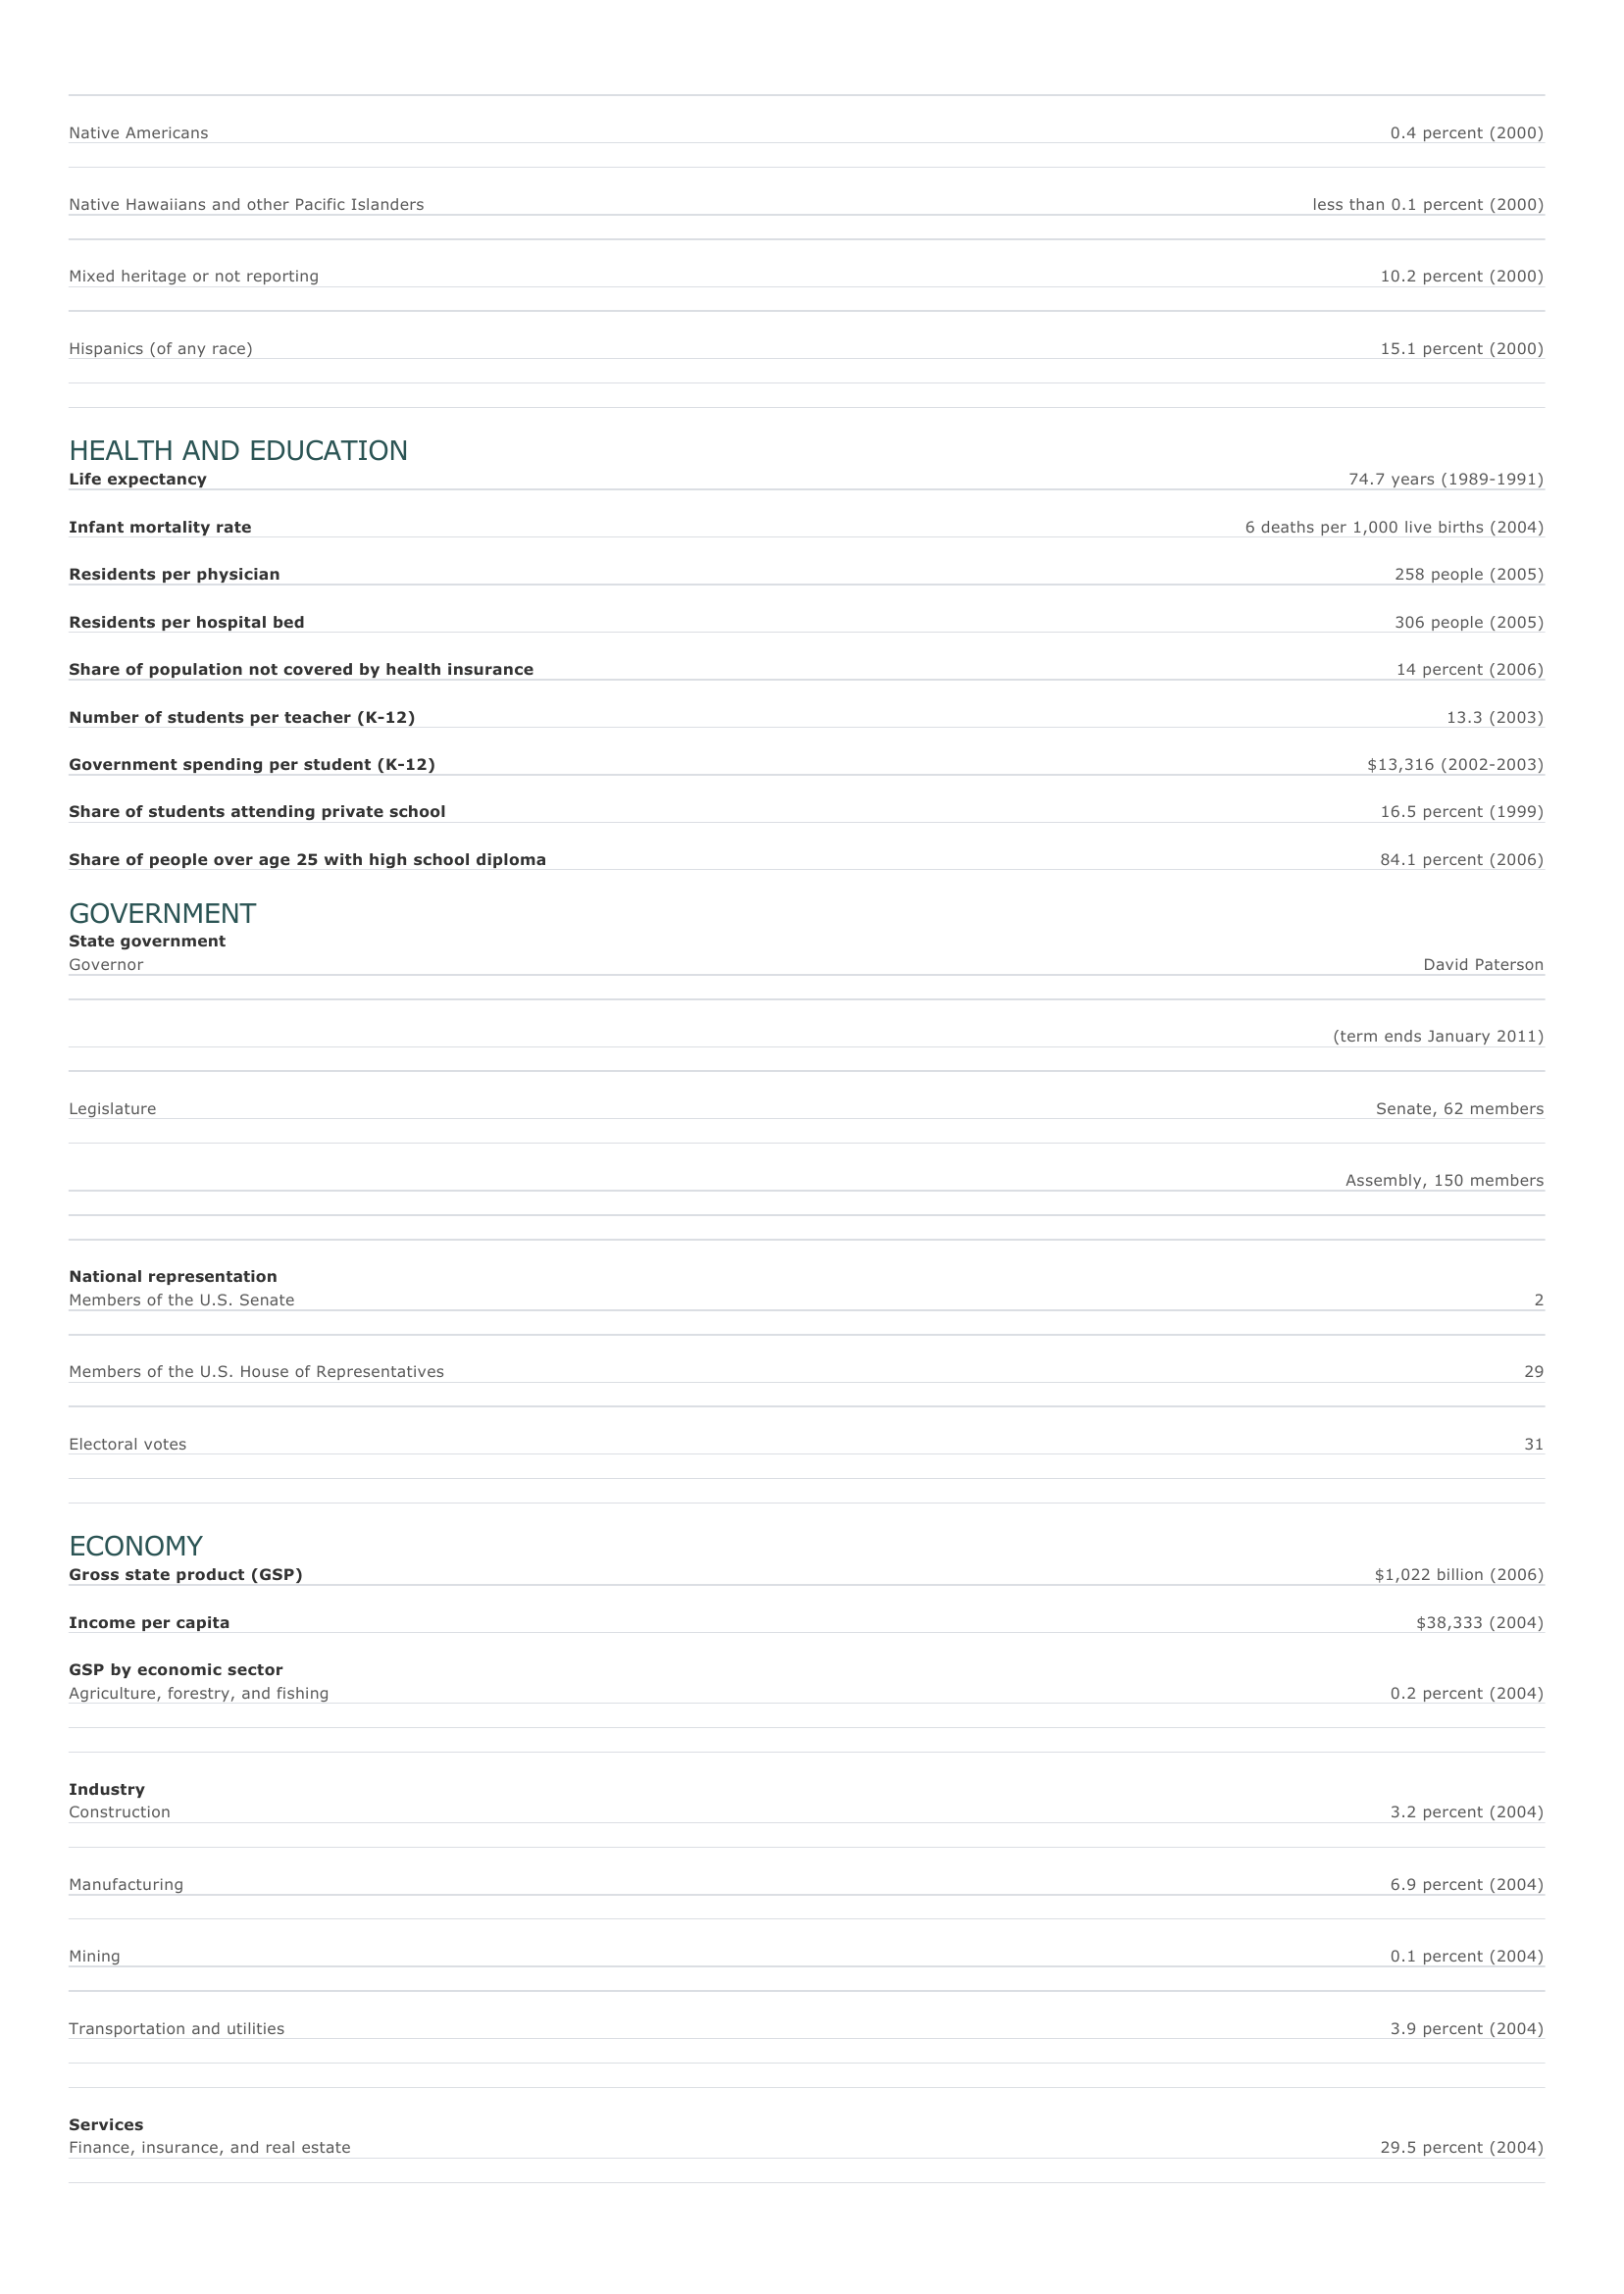
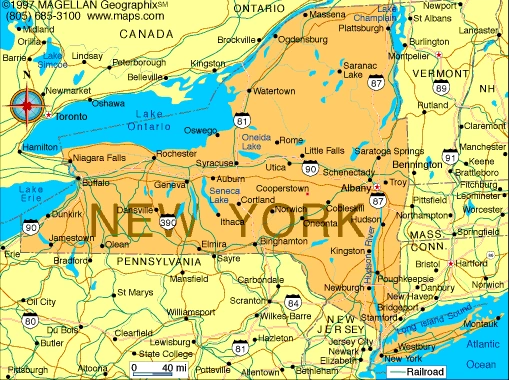
New York - Facts and Figures. GENERAL INFORMATION Capital Statehood Albany July 26, 1788 the 11th state State nickname Name for residents State motto The Empire State New Yorkers Excelsior (Higher) Abbreviation NY LAND Total area 141,299 sq km 54,556 sq mi Rank among states in total area Land area 27th 122,308 sq km 47,223 sq mi Highest point Mount Marcy 1,629 m/5,344 ft Forested land as a share of total area Federally owned land as a share of land area 61 percent (2002) 1.1 percent (2002) PEOPLE Population Rank among states in population Ten-year population growth Population density 19,297,729 (2007 estimate) 3rd 5.5 percent (1990-2000) 158 persons per sq km (2006 estimate) 409 persons per sq mi (2006 estimate) Urban population Largest cities (by population) New York 87.5 percent (2000) 8,214,426 (2006) Buffalo 276,059 (2006) Rochester 208,123 (2006) Y onkers 197,852 (2006) Syracuse 140,658 (2006) Ethnic groups Whites 67.9 percent (2000) Blacks 15.9 percent (2000) Asians 5.5 percent (2000) Native Americans Native Hawaiians and other Pacific Islanders 0.4 percent (2000) less than 0.1 percent (2000) Mixed heritage or not reporting 10.2 percent (2000) Hispanics (of any race) 15.1 percent (2000) HEALTH AND EDUCATION Life expectancy Infant mortality rate 74.7 years (1989-1991) 6 deaths per 1,000 live births (2004) Residents per physician 258 people (2005) Residents per hospital bed 306 people (2005) Share of population not covered by health insurance 14 percent (2006) Number of students per teacher (K-12) Government spending per student (K-12) 13.3 (2003) $13,316 (2002-2003) Share of students attending private school 16.5 percent (1999) Share of people over age 25 with high school diploma 84.1 percent (2006) GOVERNMENT State government Governor David Paterson (term ends January 2011) Legislature Senate, 62 members Assembly, 150 members National representation Members of the U.S. Senate 2 Members of the U.S. House of Representatives 29 Electoral votes 31 ECONOMY Gross state product (GSP) Income per capita $1,022 billion (2006) $38,333 (2004) GSP by economic sector Agriculture, forestry, and fishing 0.2 percent (2004) Industry Construction 3.2 percent (2004) Manufacturing 6.9 percent (2004) Mining 0.1 percent (2004) Transportation and utilities 3.9 percent (2004) Services Finance, insurance, and real estate 29.5 percent (2004) G overnment Information technology 10.2 percent (2004) 7 percent (2004) Retail trade 5.5 percent (2004) Wholesale trade 5.3 percent (2004) Other services 28.3 percent (2004) Employment Number of workers 9,499,000 (2006 estimate) Unemployment rate 4.5 percent (2006 estimate) Share of workers in unions 26.1 percent (2005) ENERGY, COMMUNICATIONS, AND TRANSPORTATION Electricity production Share from geothermal, solar, and wind 2 percent (2005 estimate) Share from hydroelectric 17.6 percent (2005 estimate) Share from nuclear 28.9 percent (2005 estimate) Share from thermal 52.1 percent (2005 estimate) Daily newspaper circulation per 1,000 people Share of households with Internet access Number of library books circulated per resident Length of highways 354 newspapers per 1,000 people (2006 estimate) 53.3 percent (2003 estimate) 6.9 books per person (2002) 182,405 km (2004) 113,341 mi (2004) Length of interstate highways 2,694 km (2004) 1,674 mi (2004) Length of railroad tracks 5,718 km (2004) 3,553 mi (2004) Airports 23 (2007) SOURCES The Association of American Railroads (www.aar.org), Bureau of Economic Analysis (www.bea.doc.gov), Bureau of Labor Statistics (www.bls.gov), Census Bureau (www.census.gov), Energy Information Administration (www.eia.doe.gov), Federal Aviation Administration (www.faa.gov), Federal Highway Administration (www.fhwa.dot.gov), Forest Service (www.fs.fed.us), General Services Administration (www.gsa.gov), National Agricultural Statistics Service (www.usda.gov/nass), National Center for Education Statistics (nces.ed.gov), National Center for Health Statistics (www.cdc.gov/nchs), National Telecommunications and Information Administration (www.ntia.doc.gov). Microsoft ® Encarta ® 2009. © 1993-2008 Microsoft Corporation. All rights reserved.
new york

« Native Americans 0.4 percent (2000) Native Hawaiians and other Pacific Islanders less than 0.1 percent (2000) Mixed heritage or not reporting 10.2 percent (2000) Hispanics (of any race) 15.1 percent (2000) HEALTH AND EDUCATIONLife expectancy 74.7 years (1989-1991) Infant mortality rate 6 deaths per 1,000 live births (2004) Residents per physician 258 people (2005) Residents per hospital bed 306 people (2005) Share of population not covered by health insurance 14 percent (2006) Number of students per teacher (K-12) 13.3 (2003) Government spending per student (K-12) $13,316 (2002-2003) Share of students attending private school 16.5 percent (1999) Share of people over age 25 with high school diploma 84.1 percent (2006) GOVERNMENTState governmentGovernor David Paterson (term ends January 2011) Legislature Senate, 62 members Assembly, 150 members National representationMembers of the U.S.

Senate 2 Members of the U.S.

House of Representatives 29 Electoral votes 31 ECONOMYGross state product (GSP) $1,022 billion (2006) Income per capita $38,333 (2004) GSP by economic sectorAgriculture, forestry, and fishing 0.2 percent (2004) IndustryConstruction 3.2 percent (2004) Manufacturing 6.9 percent (2004) Mining 0.1 percent (2004) Transportation and utilities 3.9 percent (2004) ServicesFinance, insurance, and real estate 29.5 percent (2004). »

↓↓↓ APERÇU DU DOCUMENT ↓↓↓

Liens utiles